
Page 15 - califmining1923
P. 15
STATISTICS OP ANNUAL PRODUCTION. 13
Total Mineral Production of California, by Years.
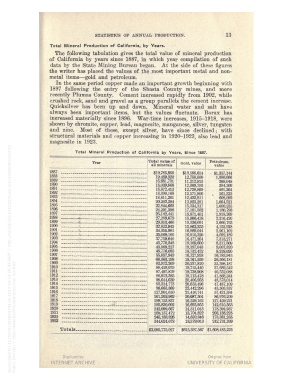
The following tabulation gives the total value of mineral production
of California by years since 1887, in which year compilation of such
data by the State Mining Bureau began. At the side of these figures
the writer has placed the values of the most important metal and non-
metal items — gold and petroleum.
In the same period copper made an important growth beginning with
1897 following the entry of the Shasta County mines, and more
recently Plumas County. Cement increased rapidly from 1902, while
crushed rock, sand and gravel as a group parallels the cement increase.
Quicksilver has been up and down. Mineral water and salt have
always been important items, but the values fluctuate. Borax has
increased materially since 1896. War-time increases, 1915-1918, were
shown by chromite, copper, lead, magnesite, manganese, silver, tungsten
and zinc. Most of these, except silver, have since declined; with
structural materials and copper increasing in 1920-1923, also lead and
maornesite in 1923.
Total Mineral Production of California by Years, Since 1887.
Tear j Total value of Gold, value Petroleum,
i all minerals value
1887 __ $19 785 868 $13,588,614 $1,357,144
1888 19469320 12,750,000 1,380,666
1889 ._ . 16 681 731 11,212,913 368,048
1890 1&039666 12,309,793 384,200
1891 . 18 872 413 12,728,869 401,264
1892 18.300 168 12.571.900 . 561,333
1893 _. 18 811 261 12,422.811 608,092
1894 20203294 13,923,281 1,064,521
1895 _ 22 844 663 15,334,317 1,000,235
1896 -_-_ 24,291398 17,181,562 1.180,793
1897 ._ 25 142 441 15,871,401 1,918,269
1898 _^ — - 27,289,079 15.906,478 2,376.420
1899 I. _ __ 29 313 460 15.336,031 2,660.793
1900 ■ __ 32 622 945 15.863.355 4,152,928
1901 L „ _ 34 355 981 16,989.044 2,961.102
1902 L 35069105 16.910,320 4,692.189
1903 __ 37 759040 16,471,264 7,313.271
1904 ._ ___ 43 778,348 19,109,600 8.317.809
1905 __ 43069227 19,197,043 9,007,820
1906 46,776,085 18,732,452 9.238.020
1907 . 55697 949 16,727,928 16,783.943
1908 _ _ 66,363,198 18,761,559 26,566,181
1909 82.972.209 20,237,870 32.398,187
1910 88,419,079 19,715,440 37,689,542
1911 _. . 87 497,879 19,738,908 40,552,088
1912 __ _._. __ 88,972,385 19,713,478 41,868,344
1913 98 644 639 20,406,958 48,578,014
1914 _ 1 93,314,773 20,653,496 47.487,109
1915 96663369 22,442,296 43,503.837
1916 _- - I 127,901,610 21,410,741 57.421,334
1917 J 161,202;9e2 20,087,501 86.976,209
1918 i 199,753,837 16.529,162 127.459.221
1919 _ _ « 195 830 002 16,695,955 142,610.563
1920 1 242,099,667 14,311.043 178.394.937
1921 .„ __„ ___ 268,157,472 15,704,822 203,138,225
1922 i 245,183.826 14.670,346 173,381,265
1923 _.._ ._ 344,024,678 ia379,013 242.731.309
Totals - _!$a095.775.027 $615,597,567 $1,608,485,225